In part 2 of this series, I described the construction of the HF antenna analyser project I’m building, from Beric Dunn’s schematics and Arduino firmware. In this article, I’ll finish some small items of construction, and look at testing and driving the analyser. All resources, pictures and files for this project are available from the project GitHub repository, with driver software available from the driver GitHub repository.
Errata
The Scan LED wasn’t working, and this was because R12 was too large, so I replaced it with a 1K Ohm. Sorted. Also, the SIL headers I’d ordered originally were too small for the pins of the Arduino Micro and DDS module. It took some time to locate suitable replacements, and find a supplier who wasn’t going to charge me £4.95 just for placing an order as a private (hobbyist) customer. Fortunately, I discovered Proto-Pic, a UK supplier that could provide 10-pin and 6-pin SIL headers. I ordered 2×10 pin Stackable Arduino Headers (PPPRT-11376) and 6×6 pin Stackable Arduino Headers (PPPRT-09280) for £4.78 including P&P. When fitting the 6-pin headers for the Arduino Micro (three per side), you may find that they are quite tight together, so sand down the inner edges a little. The Arduino Micro was still quite a tight fit, but it’s far more secure than it was.
Boxing it up
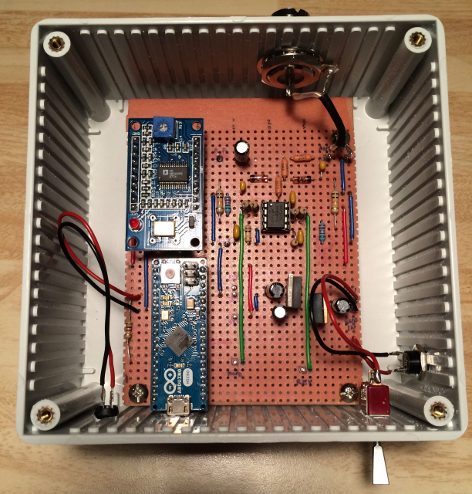
I cut a few more tracks on the veroboard near the mounting holes so that the metal spacers and screws I found in my spares box wouldn’t short anything out, then started fitting the board into the enclosure, cutting holes as appropriate. I added a switch into the power line… the result looks like this:
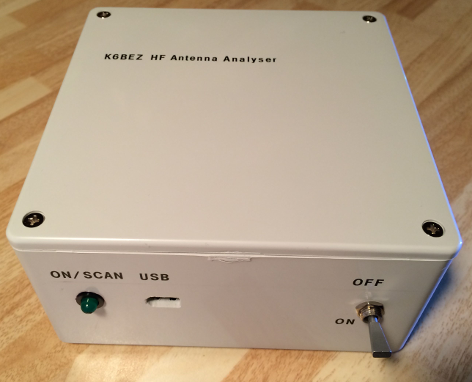
And when the LetraSet goes on:
Software, Firmware
I’ve made a few changes to Beric’s original firmware (see here), but will keep the commands and output format compatible, so if you’re driving my modified firmware with Beric’s Windows driver, everything should still work.
I use Windows 2000 on an old laptop in the Shack: I couldn’t get it working with the Arduino drivers, so I couldn’t use Beric’s Windows driver software. I needed a Linux or Mac OSX solution, so started writing a Scala GUI driver that would run on Mac, Windows or Linux, and have got this to the point where I need to add serial drivers like RxTx, getting the native libraries packaged, etc., etc.
However, that’s on hold, since I was contacted by Simon Kennedy G0FCU, who reports that he’s built an analyser from my layout which worked first time!! He’s running on Linux, and has passed the transformed scan output into gnuplot to yield a nice graph. I hadn’t considered gnuplot, and the results look far better than I could write quickly.
So, I reused the code I wrote several years ago for serial line/data monitoring, and wrote an analyser driver in C that produces nice graphs via gnuplot. So far it builds on Mac OSX. In the near future I’ll provide downloadable packages for Debian/Ubuntu/Mint, Red Hat/CentOS and hopefully Raspberry Pi.
Testing
The analyser as it stands is not without problems – the first frequency set during a scan usually reports a very high SWR – I don’t think the setting of the DDS frequency after a reset is working reliably. From looking at the DDS data sheet timing diagrams, short delays are needed after resetting, and updating the frequency – these are not in the current firmware…
Also repeated scans tend to show quite different plots – however, there are points in these repeated plots that are similar, hopefully indicating the resonant frequencies.
Beric mentioned (on the k6bez_projects Yahoo! group) that “With the low powers being used, and the germanium diodes being used, it makes sense to take the square of the detected voltages before calculating the VSWR.”…
Simon pointed out that “the variable VSWR is defined as a double. This means that when REV >= FWD and VSWR is set to 999 it causes an overflow in the println command that multiplies VSWR by 1000 and turns it into an int. Making VSWR a long should fix this.” He also suggested some other changes to the VSWR calculation…
… these are changes I’m testing, and hope to commit soon.
I’ll add some options to the software/firmware to plot the detector voltages over time for a few seconds – an oscilloscope probing the FWD/REV detector output shows some digital noise. I had added an LED-fading effect to show that the board is active, and this exacerbates the noise. This noise makes it through to the VSWR measurement. I’ll try taking the mode of several measurements… Once the DDS is generating the relevant frequency, I’m expecting these voltages to be perfectly stable.
I’m investigating these issues, and hope to resolve them in software/firmware – I hope no changes are needed to the hardware to fix the problems I’m seeing, but can’t rule out shielding the DDS, and/or using shielded cable for the FWD/REV connections between the op-amp and Arduino Micro.
In the next article, I’ll show how to drive the analyser with the driver software, and hopefully resolve the noise issue.
Will M0CUV actually find the resonant frequency of his loft-based 20m dog-leg dipole made from speaker wire? Will the analyser show the tight bandwidth of the 80m loop? Stay tuned! (groan)
73 de Matt M0CUV

September 20, 2015 at 9:53 am
5. I’ve had a report that an Arduino Pro Mini with USB to CP2102 TTL interface
does not work, but that an Arduino Uno does. The Arduino Micro works.
That might be my issue then.
September 20, 2015 at 10:41 am
xychix@PC2019:~/Downloads/ard/c/antenna-analyser-c$ sudo ./analyser -a3500000 -b3800000 -n20 -v -p/dev/ttyUSB2 -w
port: /dev/ttyUSB2
Timeout!
Did not read the first line of query data from the analyser
xychix@PC2019:~/Downloads/ard/c/antenna-analyser-c$ python -m serial.tools.miniterm /dev/ttyUSB2
— Settings: /dev/ttyUSB2 57600,8,N,1
— RTS: active DTR: active BREAK: inactive
— CTS: inactive DSR: inactive RI: inactive CD: inactive
— software flow control: inactive
— hardware flow control: inactive
— data escaping: raw linefeed: CR/LF
>>> q
K6BEZ Antenna Analyser, modifications by M0CUV
Commands: ABCDEFNOQSRV?
I’m really clueless why this C app and my own Python tool can’t talk to the board while the python build in miniterm has no issue at all.
September 20, 2015 at 7:50 pm
Managed to get it all working, had to slow down to 9600 baud but now it’s working stable
python code that allows you to put in variables as in a hyperterm and as soon as it reads result lines it will store them and print a graph in the end. You can even run multiple rounds and have it all plotted in one graph.
This file contains bidirectional Unicode text that may be interpreted or compiled differently than what appears below. To review, open the file in an editor that reveals hidden Unicode characters.
Learn more about bidirectional Unicode characters
DSS_sweeper_reader.py
hosted with ❤ by GitHub
This is still work in progress, I’m planning on really making seperate graphs for each run (different colors).
Adittionally I rewrote some of the ino code to read analog inputs 4 times with a small delay and take the average number as reading.
September 20, 2015 at 9:20 pm
Hi, many thanks for your comments on this project! I wondered about whether exact values for the various components were critical, others (on the K6BEZ mailing list?) have confirmed that they’re not (so long as you’re not way out).
Thanks for writing the python script – I started writing a Perl version, gave up, switched to Java, but had too many problems getting the Serial interface working (RxTx library) – so switched back to C for the version I published… but a good cross-platform driver program is very useful, thanks!
It has been a while since I worked on this project, I seem to recall writing some averaging into the .ino – I suspect that there’s some electronic reason that the values fluctuate as much as they do – perhaps the bridge components are not close enough together, or if I’d built my board on single-sided copper board, Manhattan style to reduce coupling effects… others have added a small buffer between the DDS and the bridge circuit, to improve matters.
I hope to revisit this project, and build a better version that also measures impedance – I have my QRP transceiver to finish first though!
Regards,
Matt M0CUV
October 1, 2015 at 7:02 am
I’ve printed a tight 3d case (externally 94mm by 74mm by 28mm and that suits like a glove)
Some results of testing on m magnetic loop can be found here:
http://preppers.nl/forum/attachment.php?attachmentid=20833&d=1442821199
as we can see the analyser is quite good when the swr is low. On higher values there is more interference. This might also be a characteristic of the magnetic loop.
The code is good enough not to be messed with anymore.
I tend to run:
10000000A
30000000B
1000N
S
view the graph.
Then alter the condensator on my magloop, close the graph and run
S
again. You’ll have a double graph.
wipe will reset the data and you will get a new graph (i use that after altering A or B).
Very happy with the end result.
Now I’m still looking for an automated antenna atuner for my FT-857D in the same price / material range 😉
October 1, 2015 at 7:07 am
I’ve also added some averaging in your ino (A to B sweep). The averaging you did was only on continuous (C) measurements if I’m not wrong. Just to avoid incompatibility I stayed with the same commands (or basically offering the user a direct connection to the terminal).
Also I’m not planning to publish my INO as the ones out are good enough and I don’t want to give new commers more doubt 🙂
In my opinion:
K6BEZ is de read to get the basiscs
Matt M0CUV is the INO to use
xychix (call sign hopefully after 5th november, novice exams) is likely the most x-platform software to get.
October 1, 2015 at 7:46 am
Just to complete it even more for new builders:
shop: http://www.banggood.com/
SKU 9409371 arduino E 2.82
SKU 915819 ad9850 E 7.26
SKU 929776 5pack of boards E 3.08
subtotal banggood: EUR 13.16
reichelt.de / reichelt.nl I bought:
GS 8 IC socket, 8-pin, double spring contact 1 1 0.051 € 0.05 €
1/4W 100K Carbon film resistor 1/4W, 5%, 100 kilo-ohms 1 2 0.10 € 0.21 €
1/4W 10K Carbon film resistor 1/4W, 5%, 10 kilo-ohms 1 2 0.10 € 0.21 €
1/4W 5,1K Carbon film resistor 1/4 W, 5%, 5.1 kOhm 1 2 0.10 € 0.21 €
1/4W 51 Carbon film resistor 1/4 W, 5%, 51 ohm 1 3 0.10 € 0.31 €
1/4W 620 Carbon film resistor 1/4Â W, 5%, 620Â Ohms 1 2 0.10 € 0.21 €
AA 143 Germanium diode, DO7, 25V, 0,5A 1 2 0.53 € 1.06 €
KERKO 100N Keramik-capacitor 100N 1 2 0.061 € 0.12 €
KERKO-500 10N Keramik-capacitor, 500V, 10N 1 3 0.11 € 0.34 €
MCP 6002-I/P Low-power dual-operational amplifier/1.8 V/1 MHz/DIP-8 1 1 0.37 € 0.37 €
SM 1,0/63RAD Subminiature-Elko, radial, 1,0µF/63Volt 1 1 0.041 € 0.04 €
UG 1094W1 BNC-print panel jack, angled, 50 Ohm 1 1 1.07 € 1.07 €
Order value 4.19€
Transport costs 6.95€
subtotal reichelt: EUR 11.14
So assuming you have
– a hot solder iron
– some soldering tin
you can build this for (13.16 + 11.14)
!!!! 24.30 Euro!!!!
Even by writing this I get the urge to build anther one 🙂
October 1, 2015 at 7:52 am
@Matt sorry for filling all the commens, everytime I press send I realise there’s more to add to make life easy for new builders.
I used:
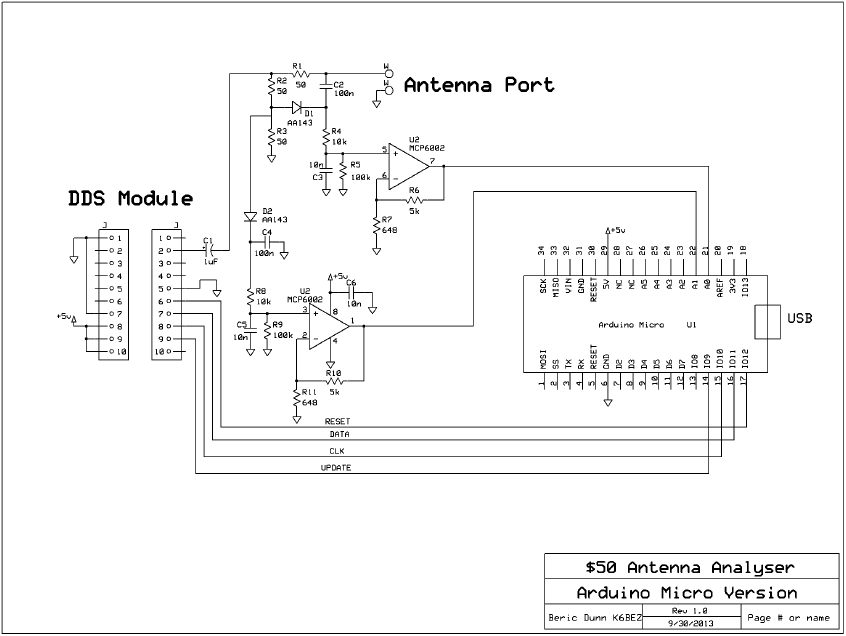
as schematic, just as Matt shows in a previous blogpost.
The 2 MCP6002’s you see in the schematic are actually combined in 1 physical MCP6002. Look at the schematic of a MCP6002 and the numbers of the legs used in the schematic.
I’m a complete noob when it comes to electronics so I only figured this out while already building 🙂 Now I’ve got a spare MCP6002.
Next to that, considering the shippingcost at reichelt I decided to buy 2 kits, which means I now have 3 MCP6002’s leftover 🙂
October 1, 2015 at 8:03 am
http://www.banggood.com/ sku 985617
and desoldering the pins from the ad9850 might make it an even smaller package.
I’ll give that a try later on as I’m mostly building on a mobile field kit.
yeasu ft-857D + magnetic loop or end fed + very small ant analyser for setting up combined with python on a phone (android) and a OTG cable to run software is the new goal 🙂
November 26, 2015 at 6:13 pm
can i use arduino nano in place of arduino micro in this project?
January 27, 2016 at 4:26 pm
yes, I used a Nano
January 27, 2016 at 4:27 pm
Oeps, wrong account 🙂
Yes, I used a nano
And as you can see I got it al working nice with my python code
January 27, 2016 at 1:34 am
Hmm, I don’t quite understand what might be the problem with my prototype (I’m using an uno). I used a 50 ohm resistor rather than antenna to verify the circuit. The graphs are pretty flat but swr gets higher with higher frequencies… 160m shows 1.2:1, 80m 1.3:1, 60m 1.5:1, 40m 2.1:1, 30m 5.1:1. I would have expected it to be closer to 1.1:1, at least through 15m. Any idea where I might look for a problem, or is this normal? Thanks for any pointers.
You’re doing a great job with your blog by the way!
January 27, 2016 at 8:37 am
Hi, thanks for the feedback – I’m afraid I don’t know off-hand what might be causing this, although I suspect that the DDS is generating a reduced signal on the higher frequencies. I’ve seen this in my latest project (before shorting the DDS accidentally!) – other builders (of the original K6BEZ project) have been successful in adding a small buffer amp to the DDS, to get a more reliable signal to the opamps.
A buffer circuit from Mark VandeWettering:
http://brainwagon.org/2015/05/01/playing-with-a-buffer-amplifier-for-a-dds/
An alternative circuit from W5DOR, as used in Riyas’ antenna analyser based on Beric’s using my firmware:
http://www.w5dor.com/w5dor-dds.html
Riyas’ code:
https://github.com/riyas-org/swranalyser
Riyas’ analyser:
http://blog.riyas.org/2015/04/a-simple-standalone-antenna-analyzer-with-ili9341tft.html
Hope this helps!
Regards,
Matt
July 7, 2016 at 6:08 pm
Did you ever get this working reliably? I’m part way through a build and not getting good results…
February 24, 2024 at 11:45 am
Hi, mine gives a rough indication, but it’s not as good as I hoped. Since building it I now have a decent oscilloscope, so may revisit it in the future if time permits. The TinyVNA is apparently very good, and fairly inexpensive.